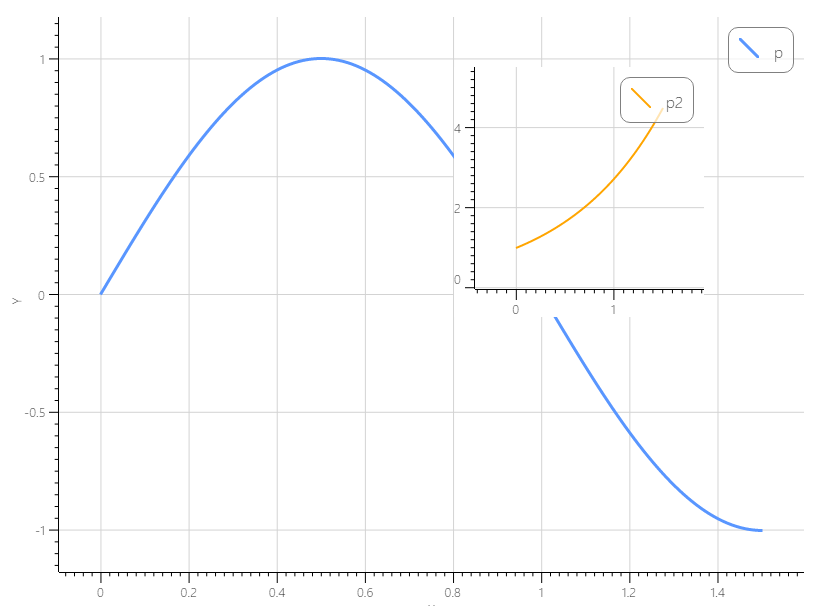
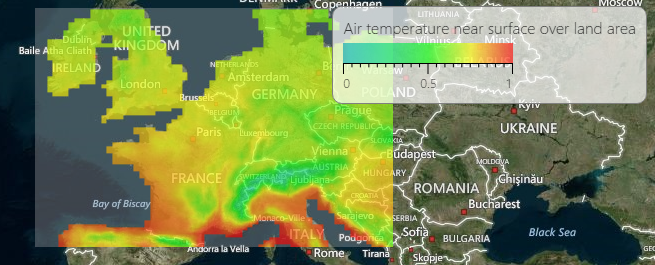
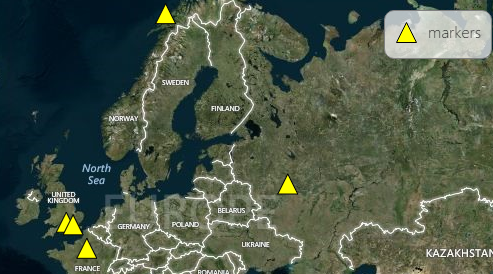


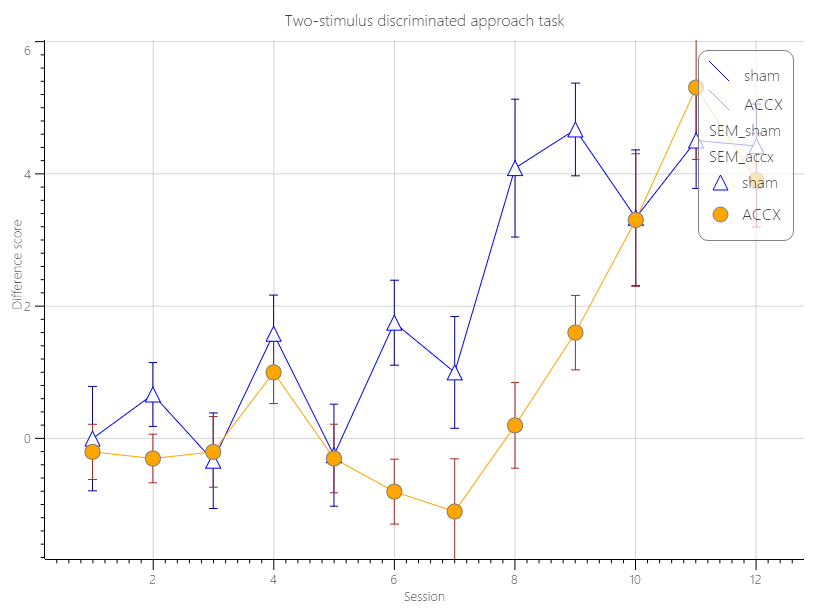
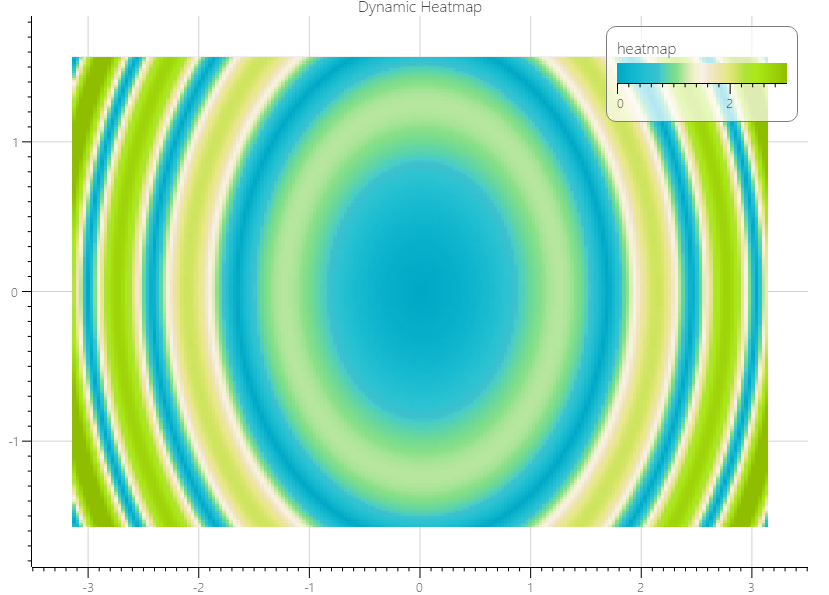
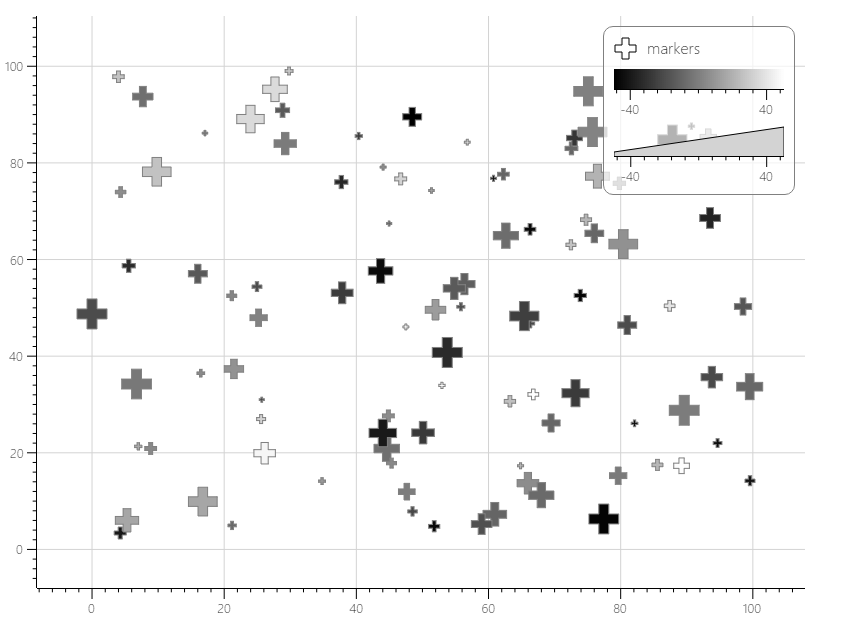
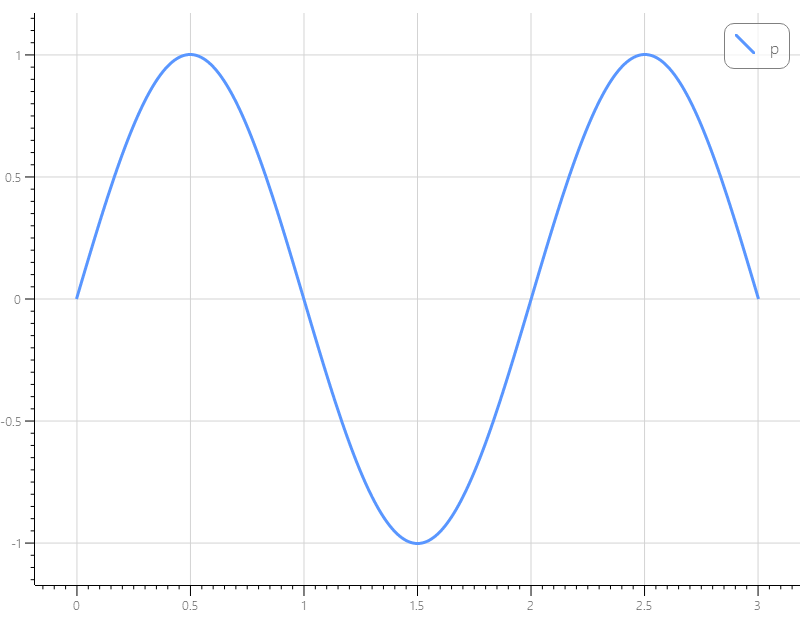
Interactive Data Display for JavaScript (IDD for short) is a set of controls for adding interactive visualization of dynamic data to your application. It allows to create line graphs, bubble charts, heat maps and other complex 2D plots which are very common in scientific software. Dynamic Data Display integrates well with Bing Maps control to show data on a geographic map in latitude/longitude coordinates. The controls can also be operated programmatically.
Published on GitHub: